Global spending on cloud-native monitoring is expected to top $18 billion by 2027, according to Gartner, yet barely 35% of enterprises say they have “full confidence” in their Kubernetes visibility. That gap is where monitoring vendors are rushing in — and fighting hard.
What was once a niche space for DevOps power users has turned into a high-stakes corporate battleground. Kubernetes, the open-source container orchestration system now used by more than 96% of Fortune 500 IT teams in some capacity, is notoriously complex to debug. The players selling observability tools — Datadog, New Relic, Grafana, and a swelling ecosystem of open-source challengers — are locked in a race to become the “default dashboard” for cloud-native operations.
The winners will shape how enterprises manage downtime, prevent outages, and cut ballooning infrastructure bills. The losers risk getting benched altogether as enterprises consolidate vendors. That has engineers, CIOs, and investors all watching closely.
The Data: A Growing Market and Rising Complexity
Here’s the thing — Kubernetes adoption isn’t slowing down. According to the Cloud Native Computing Foundation’s most recent survey, 79% of organizations are running Kubernetes in production, a jump from 58% just three years ago. At the same time, Datadog’s Q2 2025 earnings call reported a 26% year-over-year revenue jump, driven heavily by Kubernetes monitoring demand.
But complexity is the hidden tax. A 2025 report by Dynatrace found that teams spend nearly 40% of their time simply trying to identify root causes of performance issues in Kubernetes clusters. The monitoring market exists largely to cut that number in half.
“It’s not just logging anymore,” said RedMonk analyst Rachel Stephens. “You need traces, metrics, event visibility, and cost analytics all stitched together. That’s why enterprises are consolidating tools, and why the vendors are desperate to prove they can be the single pane of glass.”
The People: Vendors, Engineers, and Investors
Inside the trenches, engineers are blunt about the stakes. “When Kubernetes goes down, you don’t just lose a web app, you lose the foundation the whole stack runs on,” said a senior site reliability engineer at a Fortune 100 financial firm who asked not to be named. “We need visibility that just works, without adding three more layers of complexity.”
But Wall Street is tuned into the story too. Datadog’s valuation climbed to over $40 billion this year, largely because of its cloud observability dominance. New Relic, newly under private equity ownership after a $6.5 billion take-private deal in 2023, is betting its existence on whether it can claw back modern Kubernetes mindshare.
Meanwhile, open-source competitors such as Grafana and Prometheus are acting like spoilers. Both are free at the base tier, and both are beloved by grassroots engineers. But monetization remains uneven, drawing skepticism from investors who worry that large-scale enterprises will demand fully integrated, polished platforms.
“This smells like the APM wars all over again,” said an investor familiar with the sector. “You’ve got incumbents, startups bleeding cash, and a lot of duplication of features. The market is big enough, but it won’t support ten major winners.”
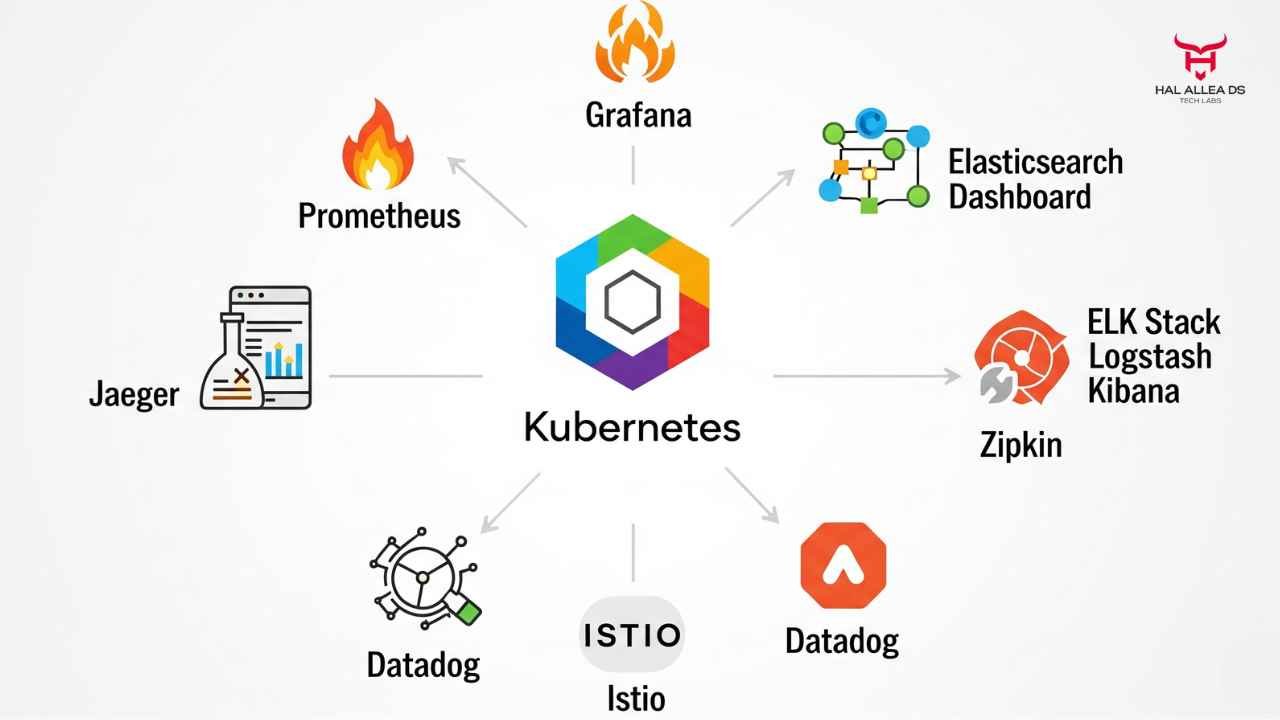
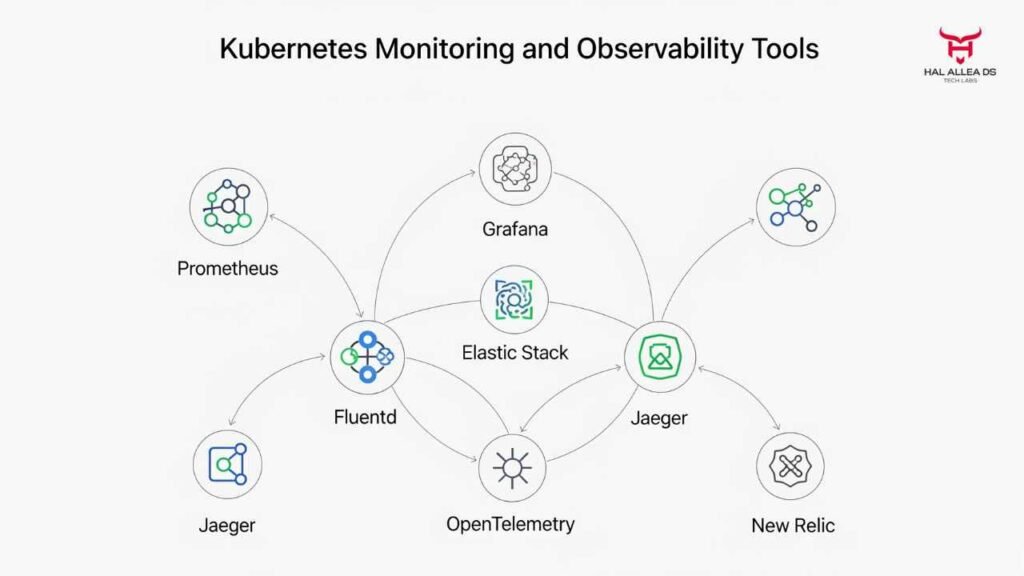
The 7 Best Kubernetes Monitoring and Observability Tools (2025 Edition)
Here’s the shortlist that most enterprise teams — and investors — are betting on this year:
1. Datadog Kubernetes Monitoring
- What it does best: End-to-end integration. Tight coupling with cloud providers and Kubernetes.
- Impact: Datadog’s winning advantage is simplicity — set it up once, view metrics, logs, traces, and even cost breakdowns in one UI.
2. New Relic Pixie Integration
- What it does best: Deep, code-level observability with eBPF-powered insights.
- Impact: Strong developer loyalty, though pricing remains a sticking point post–private equity shake-up.
3. Prometheus (Open Source)
- What it does best: Flexible metric collection, rich scraping ecosystem, and Kubernetes default.
- Impact: Still the de facto standard in raw metrics, but “DIY fatigue” is setting in for some enterprises.
4. Grafana Cloud
- What it does best: Beautiful dashboards, integrates Prometheus and Loki for logs.
- Impact: The darling of engineers who want customization, though supportability concerns limit adoption at scale.
5. Dynatrace Kubernetes Manager
- What it does best: AI-driven root cause detection and cost visibility.
- Impact: Expensive but provides breadth — strong penetration in regulated industries (finance, healthcare).
6. Sysdig Secure + Monitor
- What it does best: Security meets observability, powered by Falco (open-source).
- Impact: Appeals to DevSecOps teams that want compliance and runtime monitoring in one suite.
7. Elastic Observability
- What it does best: Search-first observability (metrics, logs, traces tied to ElasticSearch).
- Impact: Gaining traction with enterprises already relying on Elastic for search, though cost scaling worries persist.
The Fallout: What’s at Stake
Here’s where things get tricky. Enterprises consolidating down to “one or two” monitoring vendors put enormous pressure on the smaller players. Analysts now predict as many as 30% of venture-backed observability startups will fold or be acquired in the next 24 months.
For customers, that means contract volatility and the possibility of rapid tool sunsets. For engineers, it means learning yet another platform when the firm switches vendors. And for investors? The space has become a battleground where market share shifts can swing valuations by billions in a single quarter.
The corporate spin tends to paint the consolidation as “streamlining costs.” But insiders whisper another reality: too many tools, too few integrations, and not enough engineers willing to be on call for four dashboards.
As one industry veteran put it: “Pick two vendors. One for breadth, one for backup. Anyone trying to run five or six monitoring systems is lighting money on fire.”
Closing Thought
The Kubernetes monitoring wars are only heating up. Datadog currently leads on revenue and integration, but Grafana, Prometheus, and New Relic are betting on grassroots loyalty to win long-term traction. Meanwhile, security-focused challengers like Sysdig are carving out niche empires inside regulated industries.
The deeper question: will enterprises bet on consolidated SaaS suites that promise simplicity, or will engineers force CIOs to back open-source-first strategies that are cheaper but require more elbow grease?
The market rarely allows for both. The real question now is: when Kubernetes monitoring picks its permanent winners, will those winners look more like Datadog — or like GitHub?
